Master Your Personal Balance Sheet Command Center
|
7
min read

Welcome to the central hub of the GetMiryon User Manual. GetMiryon is a privacy-first, desktop-based personal balance sheet tracker and net worth dashboard designed to give you absolute control over your financial legacy.
If you are new to the platform and want to understand our core design philosophy, read our comprehensive overview on What is GetMiryon. For a practical look at how to build this tool into your monthly financial routine, explore My GetMiryon Workflow.
Because your financial data remains completely offline, processed entirely on your local machine, learning to navigate the User Interface (UI) effectively is your first step toward true data sovereignty. This master guide provides an end-to-end walkthrough of GetMiryon’s five core screens. Bookmark this page as your foundational reference map; you will find links throughout to deeper, step-by-step documentation for specific tasks.
The Dashboard Screen
The Dashboard Screen is your financial cockpit. It aggregates all your local data points and converts your global assets into your chosen base currency, serving as your primary strategic window for macroeconomic wealth management.
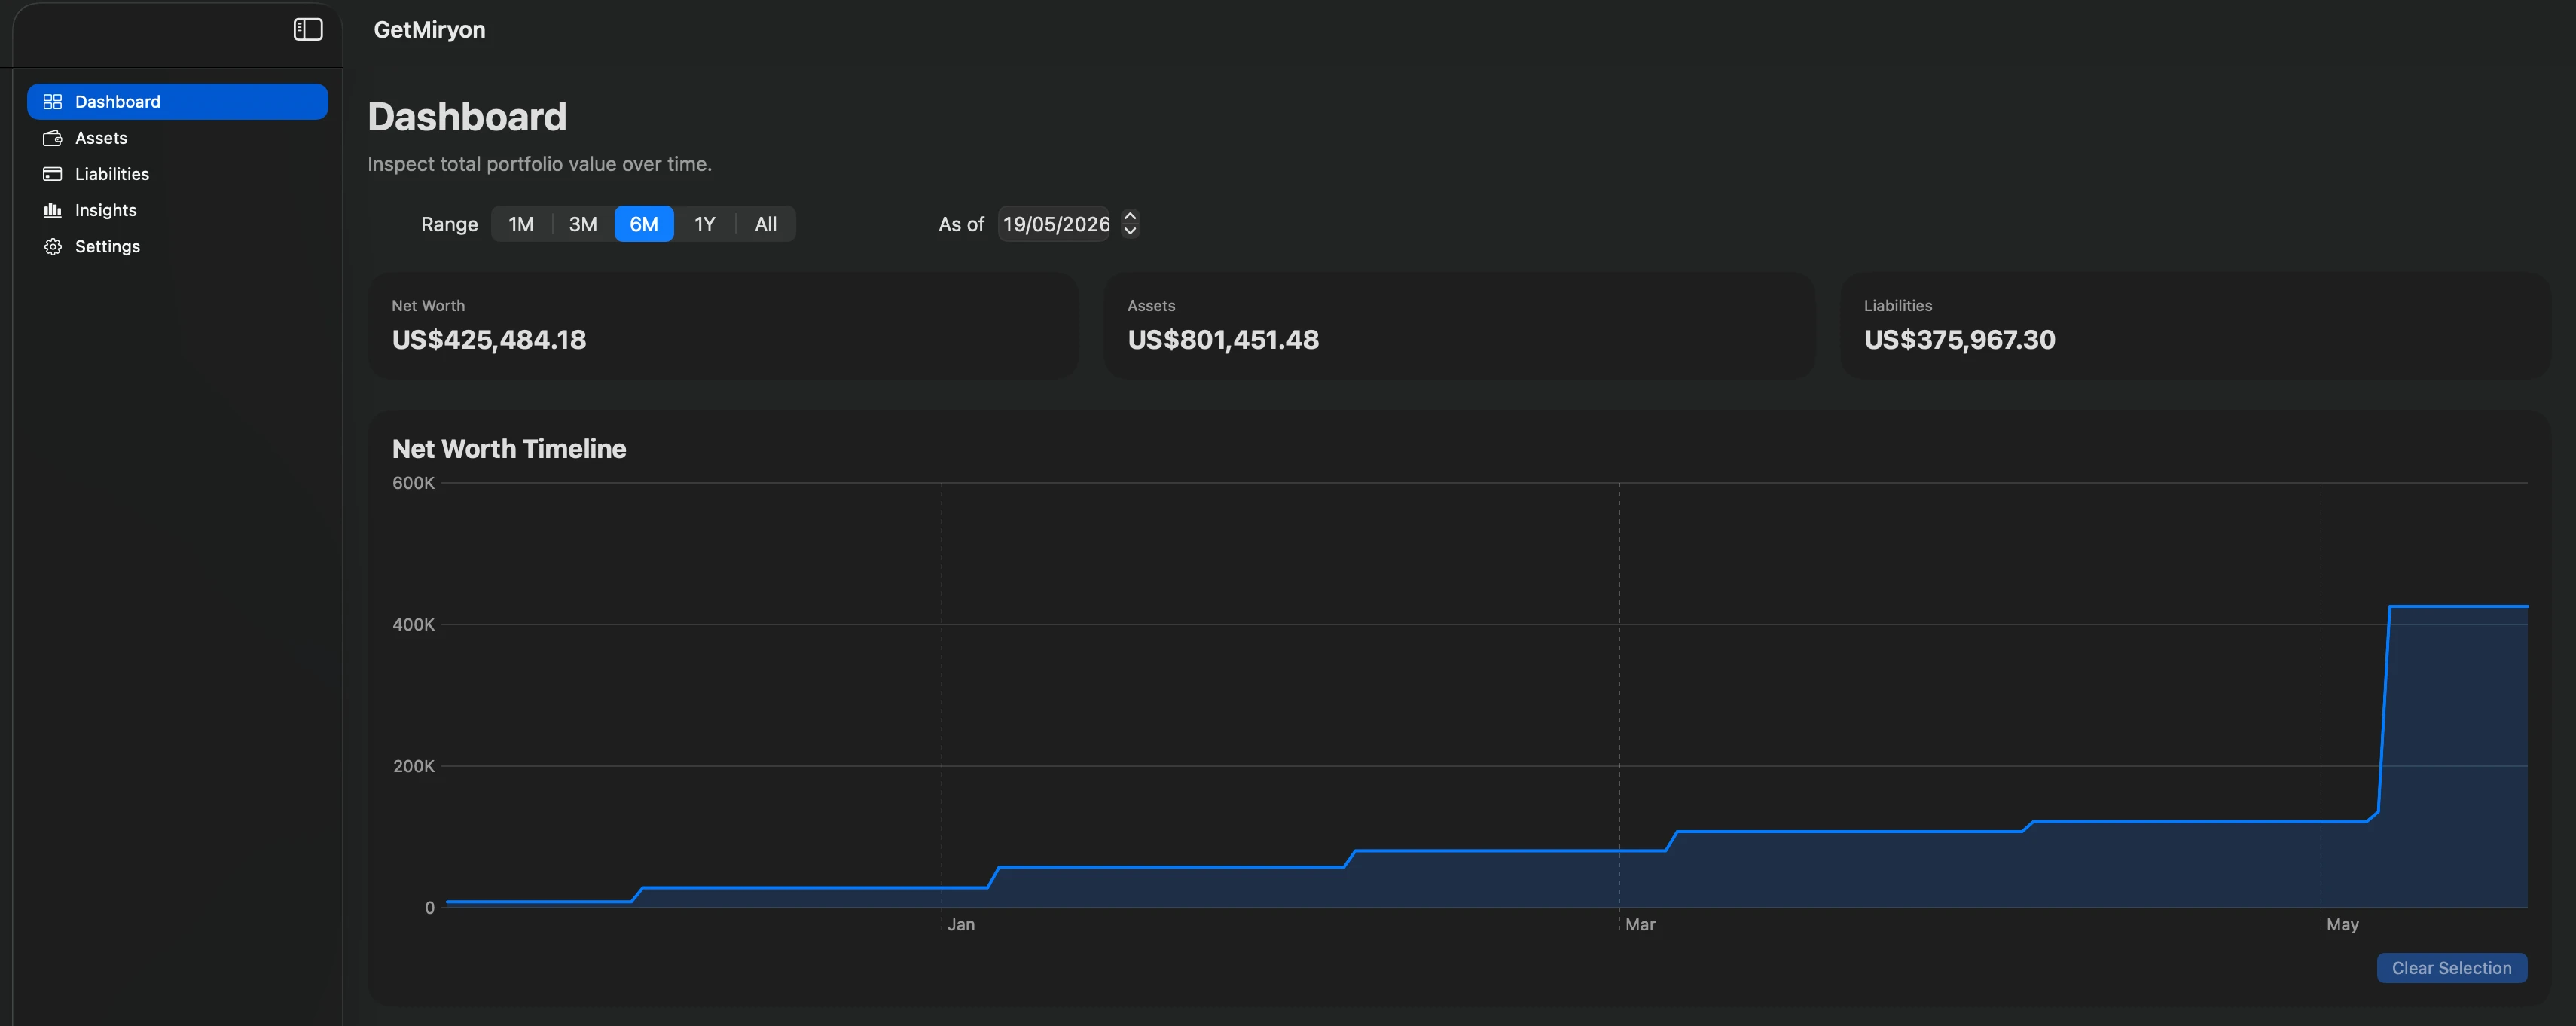
Top Section: Time-Travel Filtering
Period Filter: Quickly toggle your charts between the last 1 month, 3 months, 6 months, or 1 year to observe short- or long-term structural momentum.
Date Filter: Use the As-Of Value Date picker to step back in time. This instantly filters your entire personal balance sheet data to reflect that exact calendar day.
Middle Section: The Net Worth Timeline
Macro Cards: Displays your exact Net Worth, Total Assets, and Total Liabilities in your base currency according to your chosen filters.
Interactive Trend Graph: Hover over any point on the timeline to reveal a detailed tooltip summary of that date.
Snapshot Locking: Click on any specific historical node on the timeline. This action dynamically updates the bottom section to lock in that day's asset allocation, liability distribution, and category tables.
Clear Selection Button: Click this to release your historical snapshot filter and return the entire dashboard to today's current view.
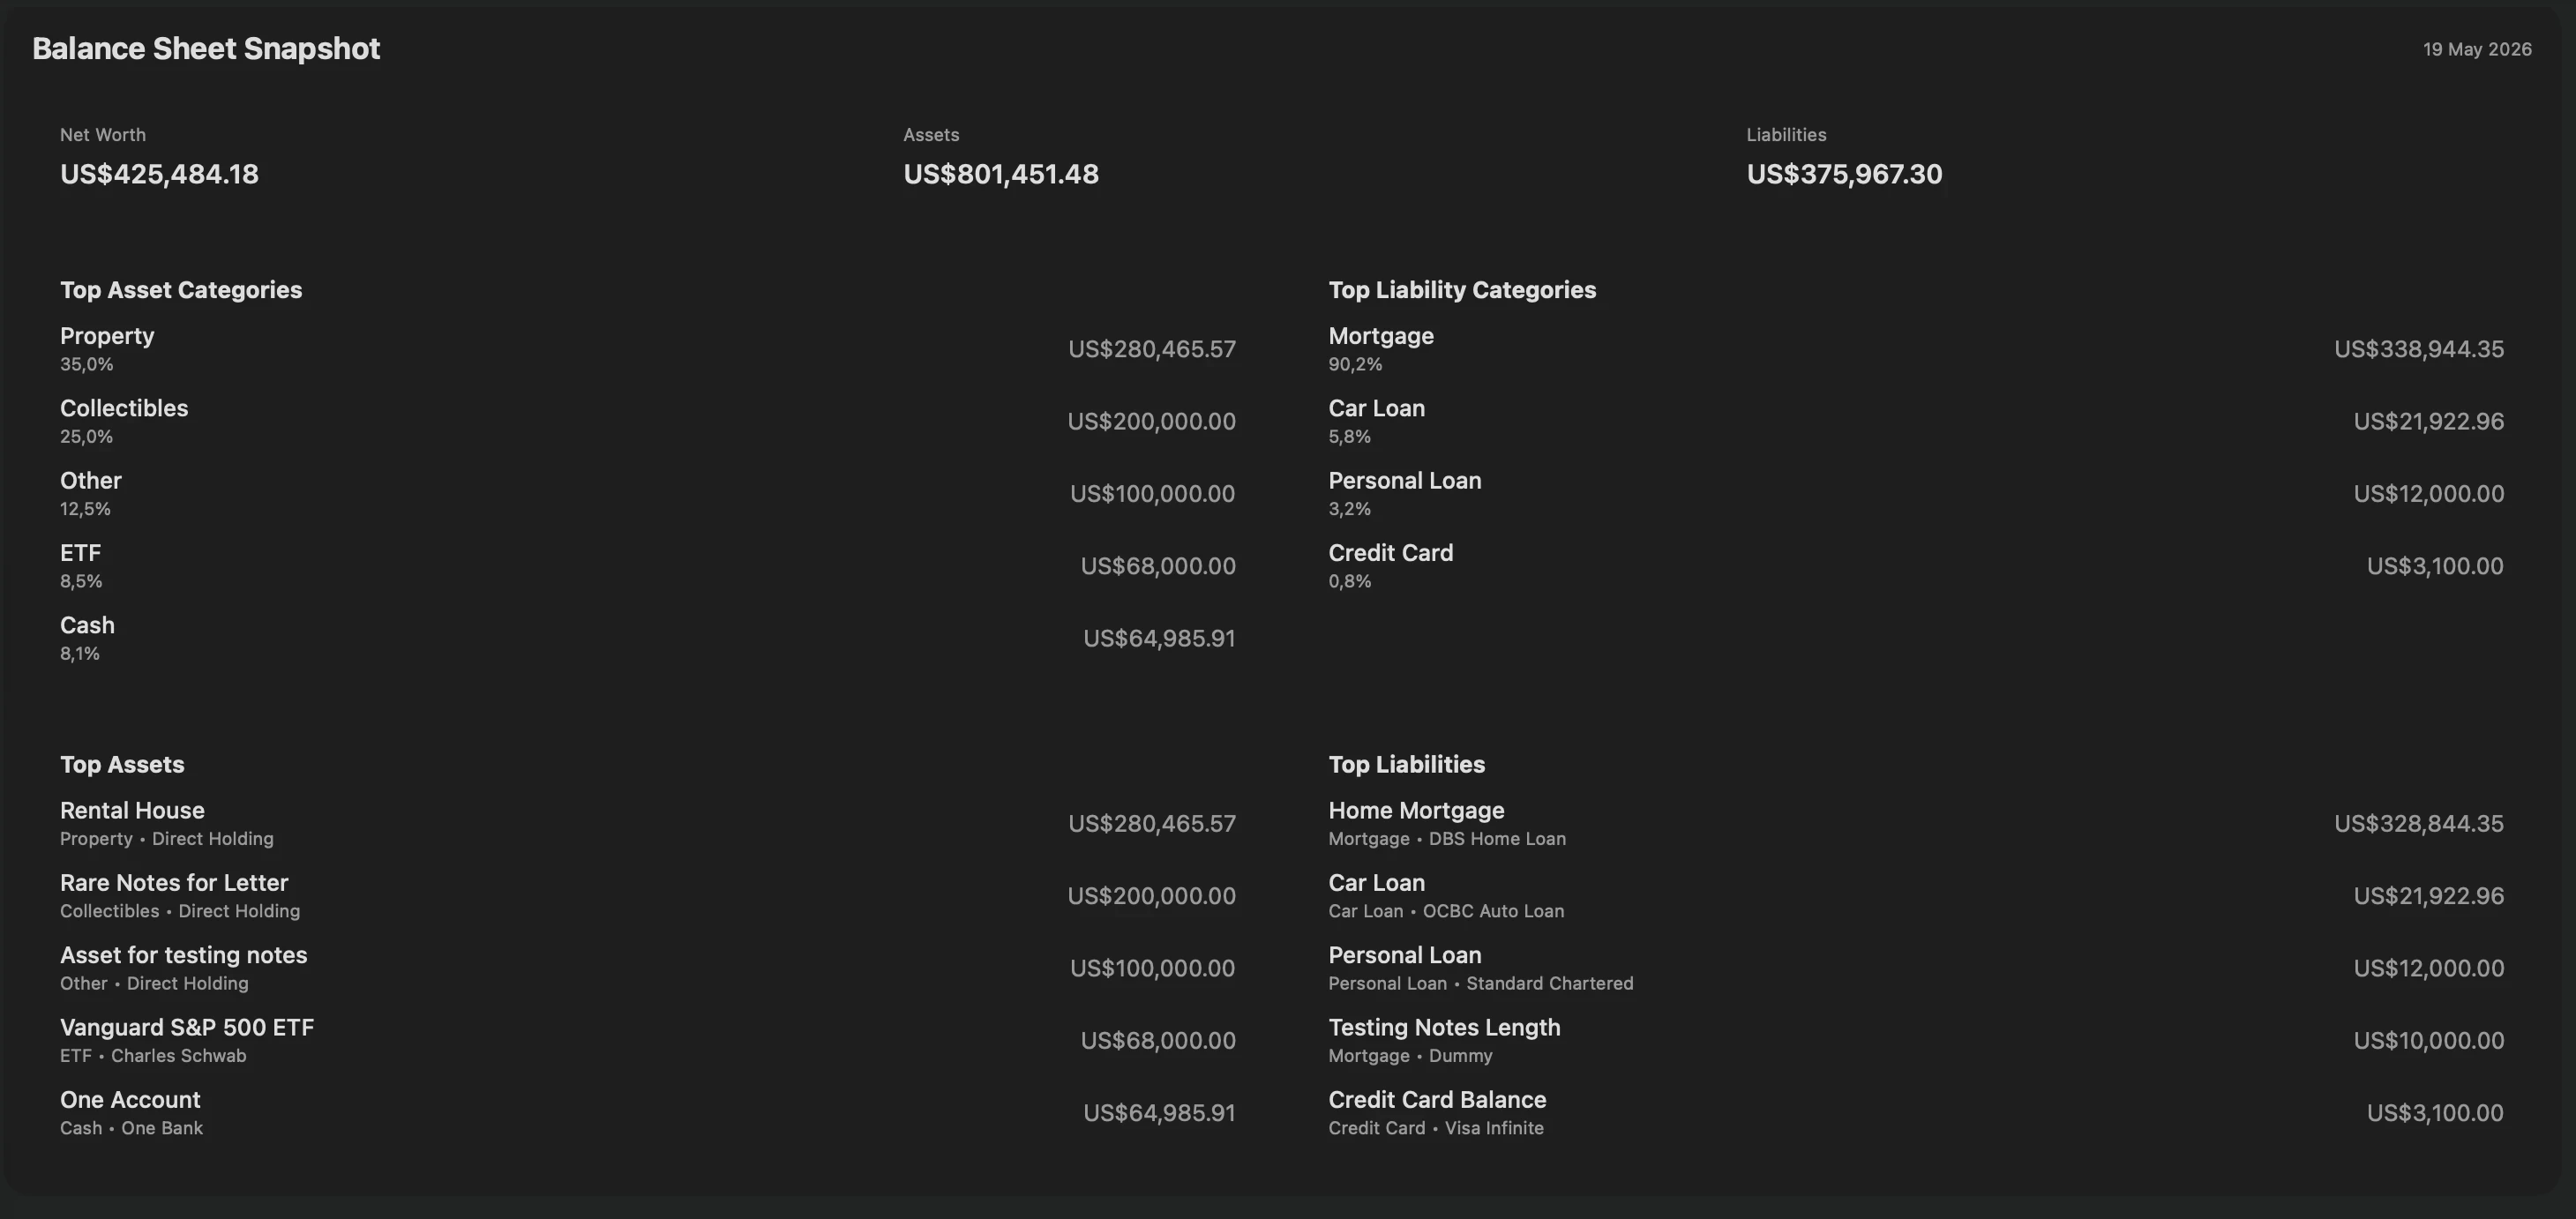
Bottom Section: Structural Breakdowns
Balance Sheet Snapshot: Displays a quick-view table showcasing your top asset and liability categories, alongside your largest individual holding accounts.
Asset Allocation: Features a granular asset breakdown table alongside a responsive pie chart showing your exact holdings mix (e.g., Cash vs. Real Estate vs. Stocks).
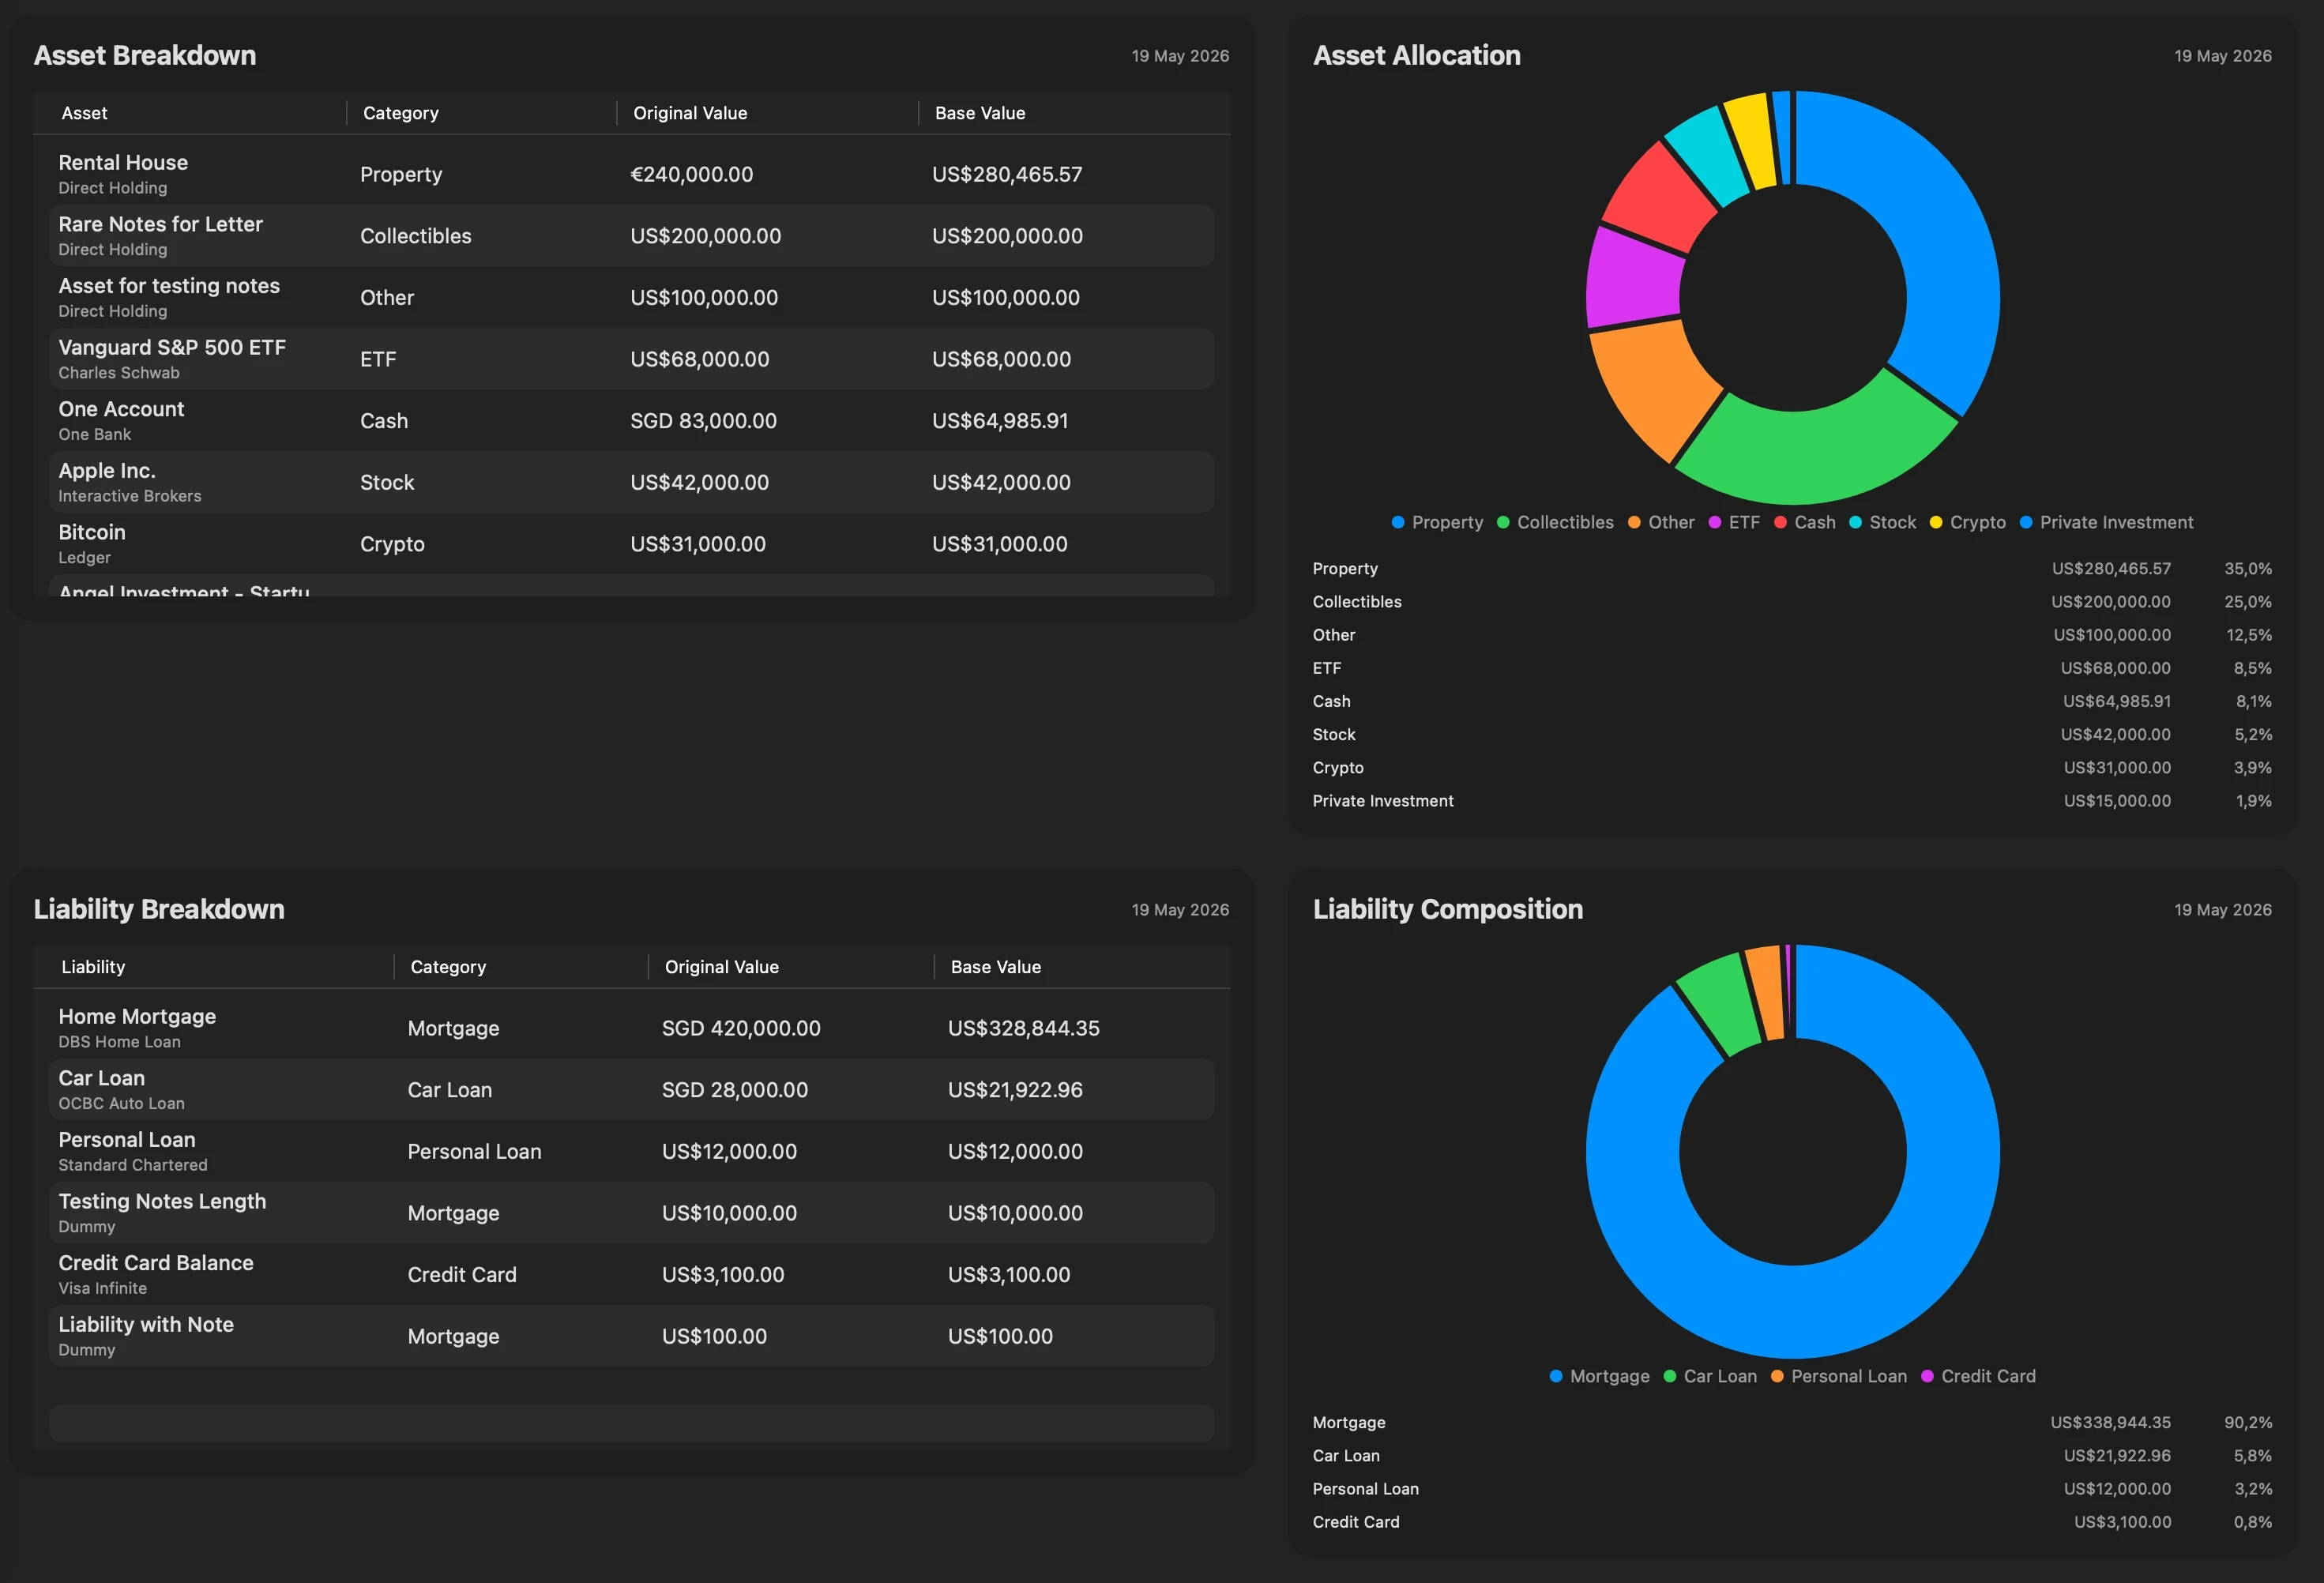
Liability Composition: Features a structured debt tracking table matched with a pie chart visualizing your short-term versus long-term obligations.
The Assets View Screen
The Assets View Screen is where you construct and manage everything you own. It handles traditional fiat bank accounts alongside alternative assets like precious metals and cryptocurrencies.
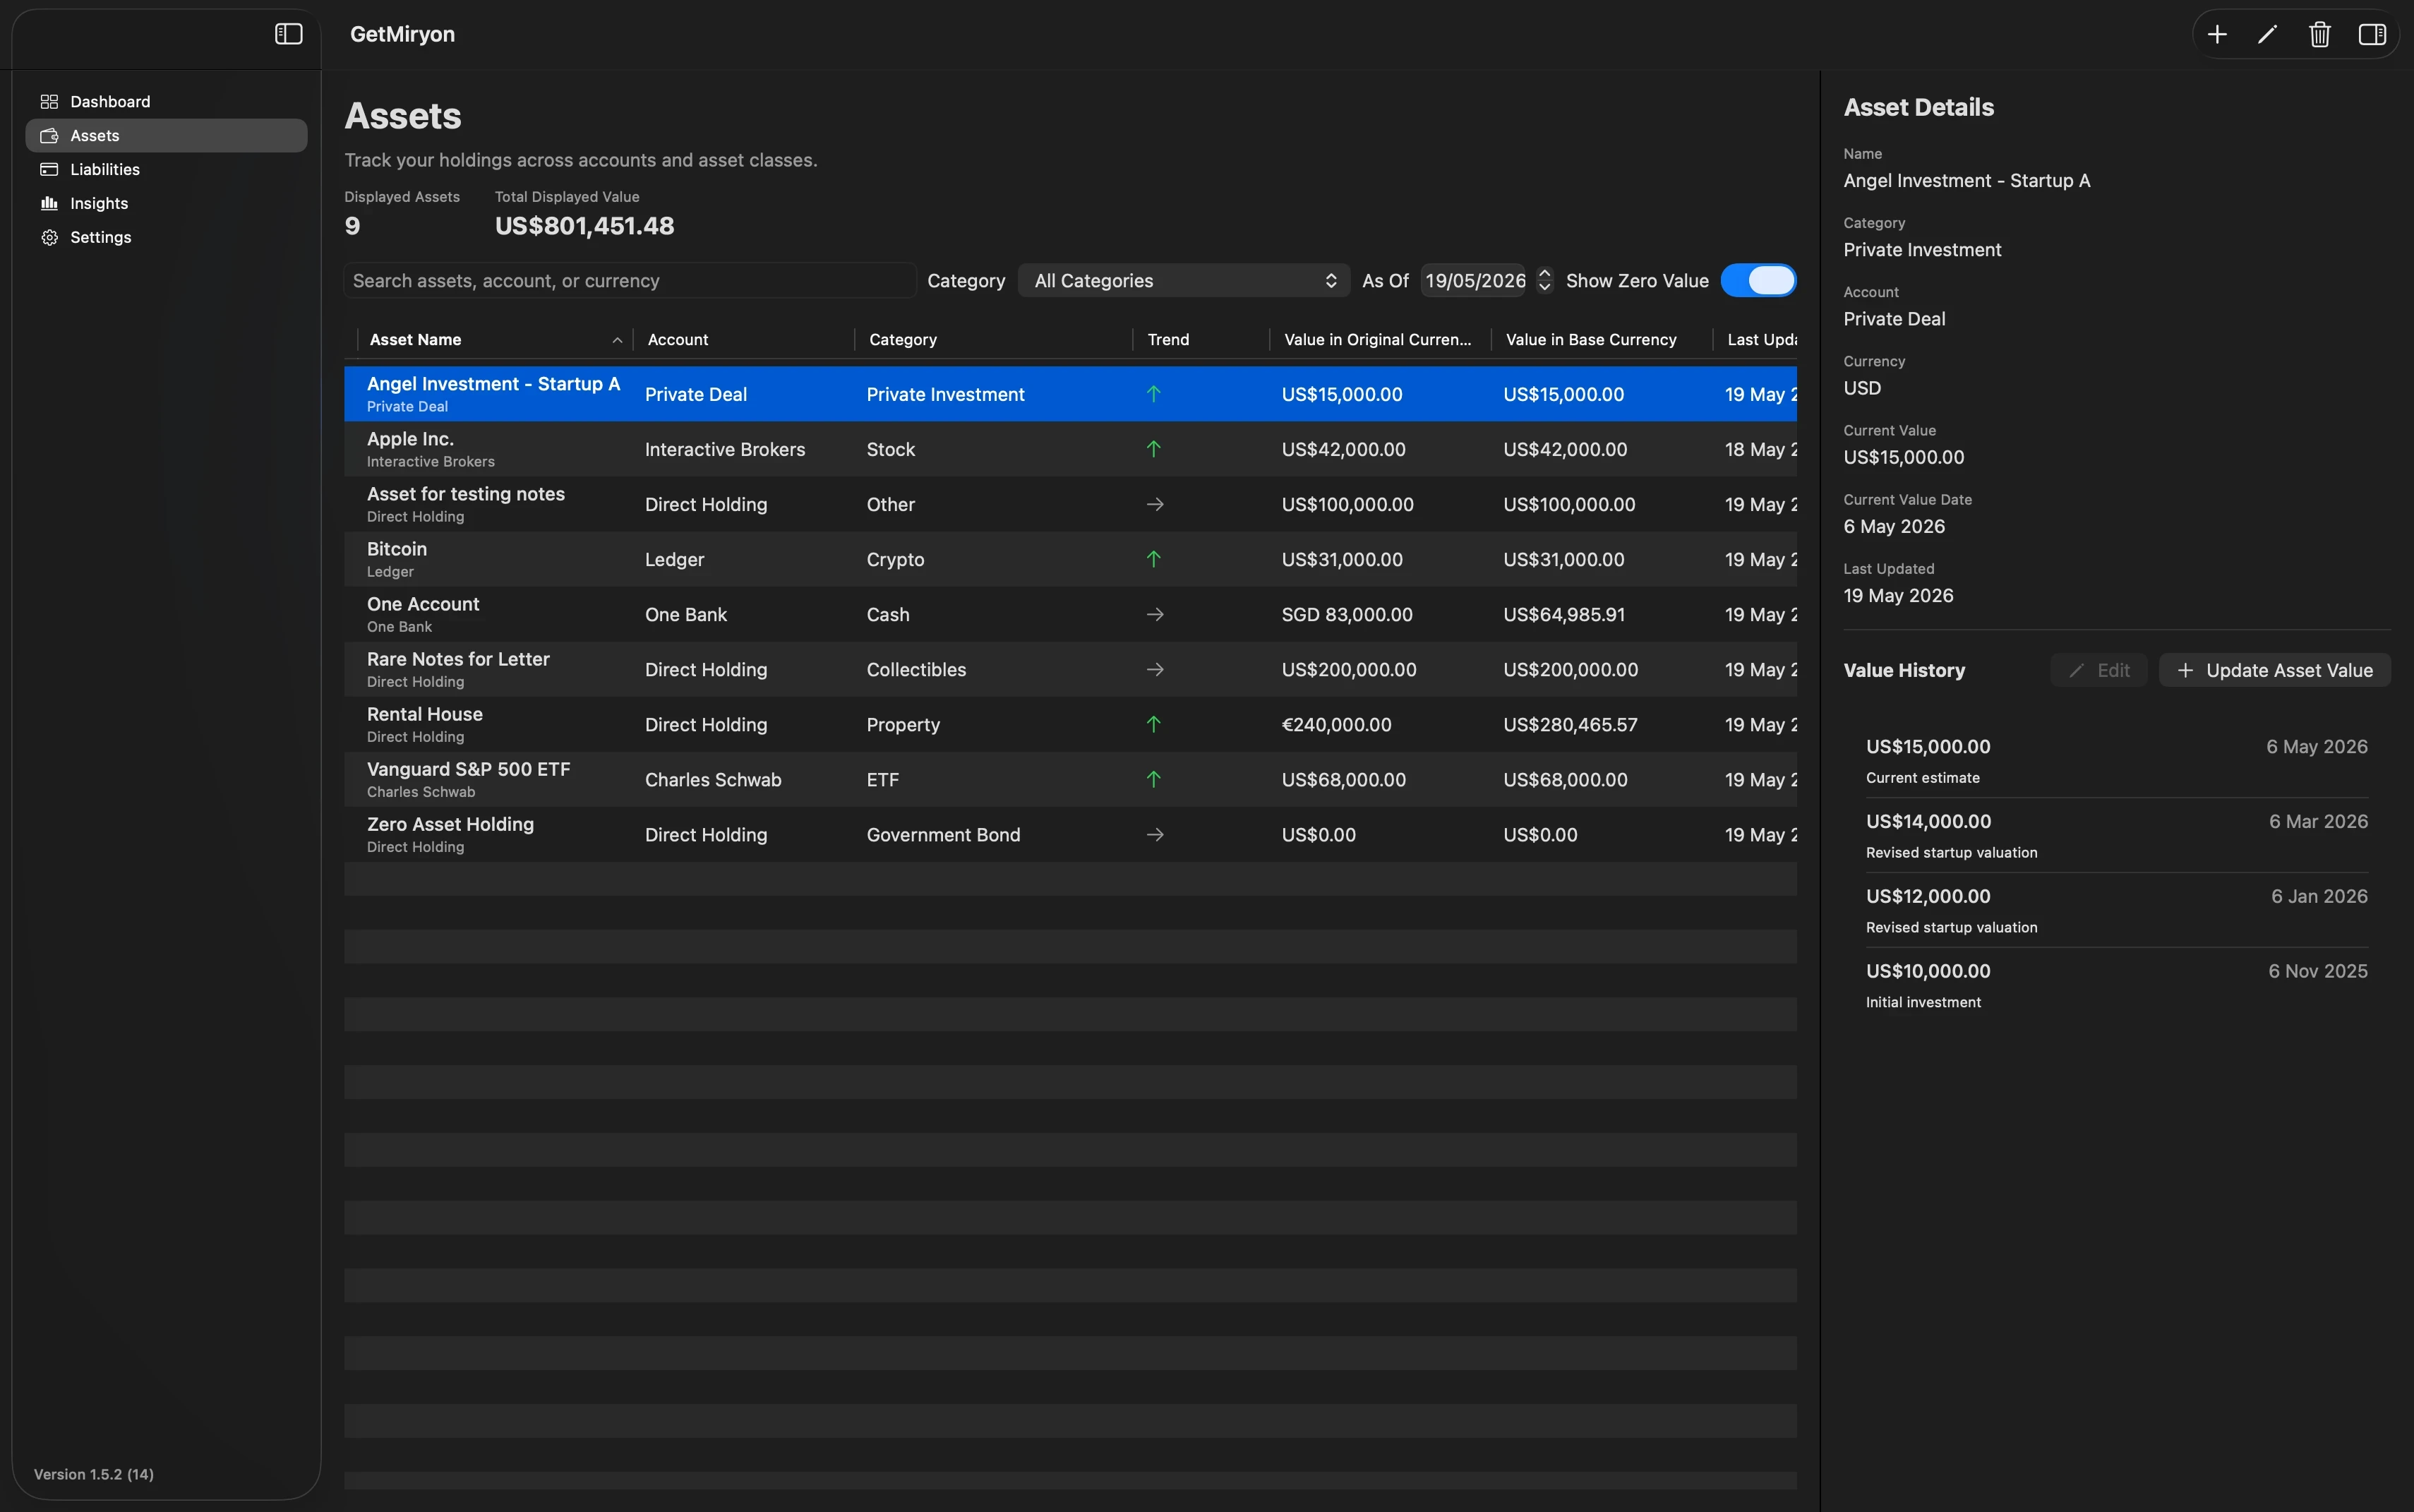
Top Right Action Bar
Add Asset Button (+): Launches the entry sub-dialog. Learn more in our dedicated guide: How to Add and Update Assets in GetMiryon.
Edit Asset Button (Pencil): Opens structural metadata adjustments (modifying asset names, notes, or currencies).
Delete Asset Button (Trash): Permanently purges an asset configuration from your local hard drive database.
Details Pane Toggle: Shows or hides the right-side summary sliding panel.
Top Section: Local Search and Context Filtering
Aggregate Counters: Displays the exact total number of individual assets tracked, alongside their combined value converted into your base currency.
Global Search Box: Instantly filters rows down as you type. It parses asset names, account names, original currency symbols, and text stored inside your custom notes.
Category Selector: Filters the view to specific asset classes (e.g., showing only Crypto, Precious Metals, or Property).
"As Of" Value Date Filter: Shows what your asset ledger looked like on any specific calendar date.
Zero-Value Toggle: Hide or show closed accounts or completely liquidated positions that hold a zero balance.
Bottom Section: The Asset Table
The Assets Table: Your primary workspace, displaying accounts, categories, native currency values, and base currency conversions matching your filters.
The Right Asset Details Pane: Triggered by selecting an individual asset row. This pane slides out on the right to reveal foundational item metadata alongside a comprehensive, chronological Value History Section. Here you can add or edit historical, effective valuation entries to trace how that specific asset grew over seasons.
The Liabilities View Screen
The Liabilities View Screen uses a layout mirrored after the asset interface, ensuring user comfort while tracking debts, obligations, margins, and payables.
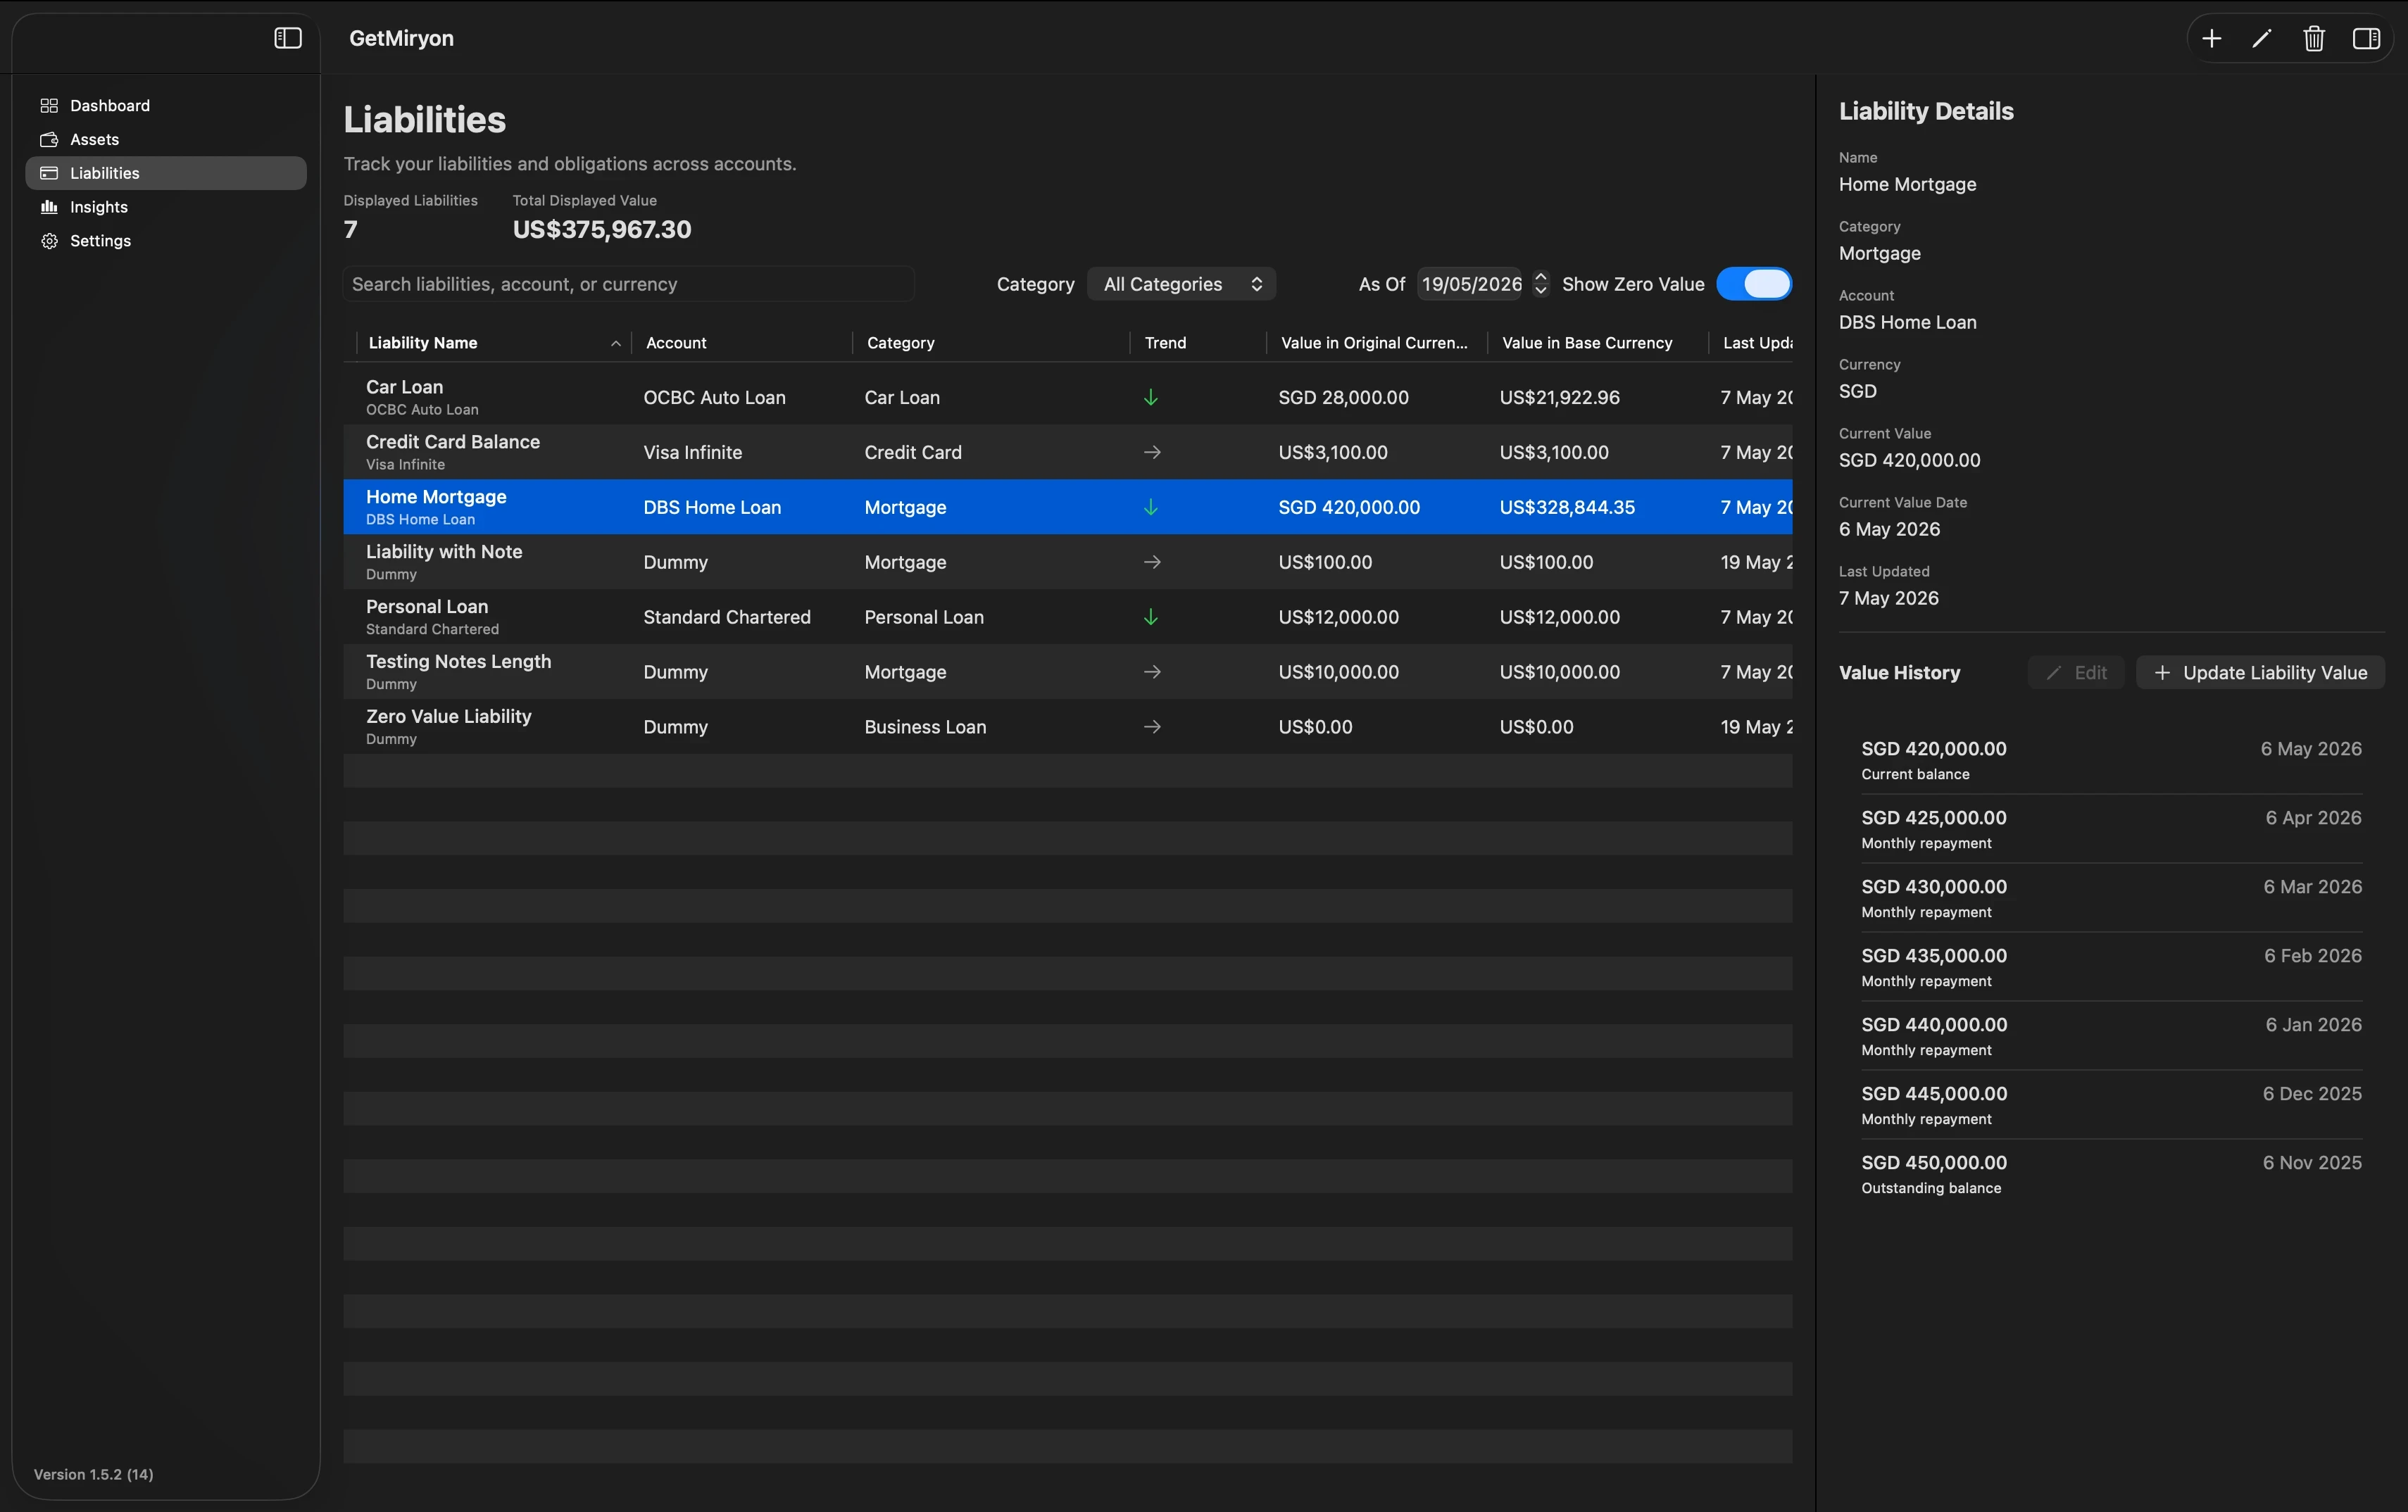
Top Right Action Bar
Add Liability Button (+): Launches your debt registration window. Read our full walkthrough: How to Add and Update Liabilities in GetMiryon.
Edit Liability Button (Pencil): Modifies general debt parameters like account numbers, categories, or notes.
Delete Liability Button (Trash): Removes a liability profile permanently from your system.
Details Pane Toggle: Shows or hides the right-side historical table panel.
Top Section: Risk Filtering
Obligation Counters: Displays your total number of outstanding liability entries alongside your cumulative total debt weight in your base currency.
Search Engine Box: Filters lines in real time based on your liability name, your lending institution's name, currency codes, or contract notes.
Category Filter & Date Pickers: Dynamically isolates items like Mortgages, Credit Cards, or Tax Payables as of an effective valuation day.
Zero-Value Toggle: Hides or reveals fully paid-off debts and completely cleared lines of credit.
Bottom Section: The Liability Workspace
The Liabilities Table: An offline overview of your active debt rows, outstanding principals, and native-to-base currency weights.
The Right Liability Details Pane: Highlight any debt row to open this sliding panel. It displays contract rules alongside your Value History Section, allowing you to record historical loan payments, statement balances, or principal paydowns.
The Insight Screen
The Insight Screen shifts focus from raw data ledger values to institutional-grade, corporate-modeled financial diagnostic relationships.
Top Section: Core Metrics Summary
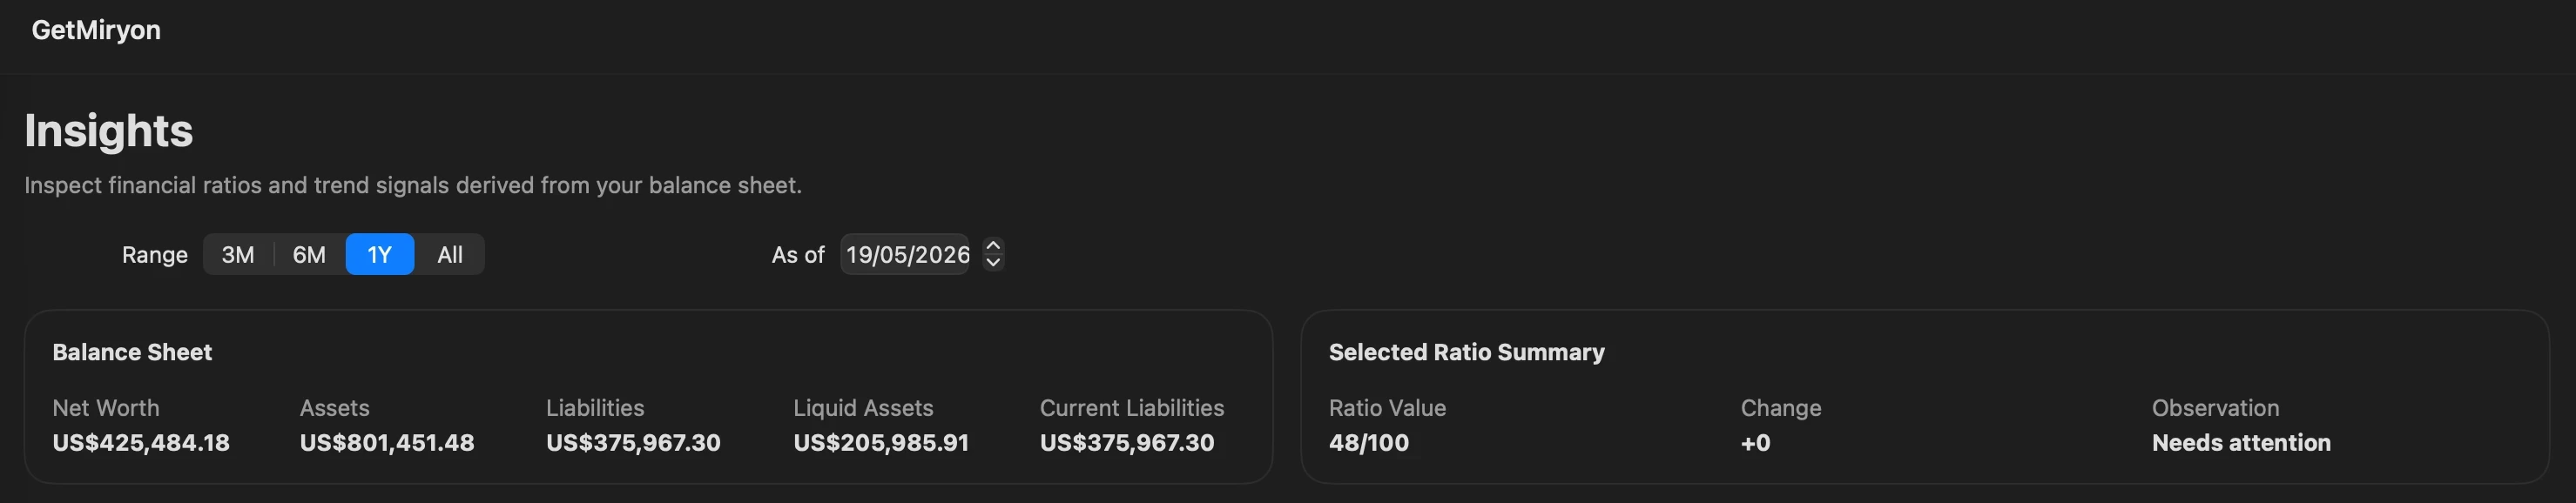
Time & Date Filters: Set your evaluation windows to 3 months, 6 months, or 1 year relative to your chosen historical effective date.
Balance Sheet Card Summary: A high-level overview banner showing your Net Worth, Total Assets, Total Liabilities, Total Liquid Assets, and Total Current (Short-Term) Liabilities.
Ratio Summary Card: Displays a diagnostic summary for whichever financial metric you currently have active.
Bottom Section: The Diagnostic Engine
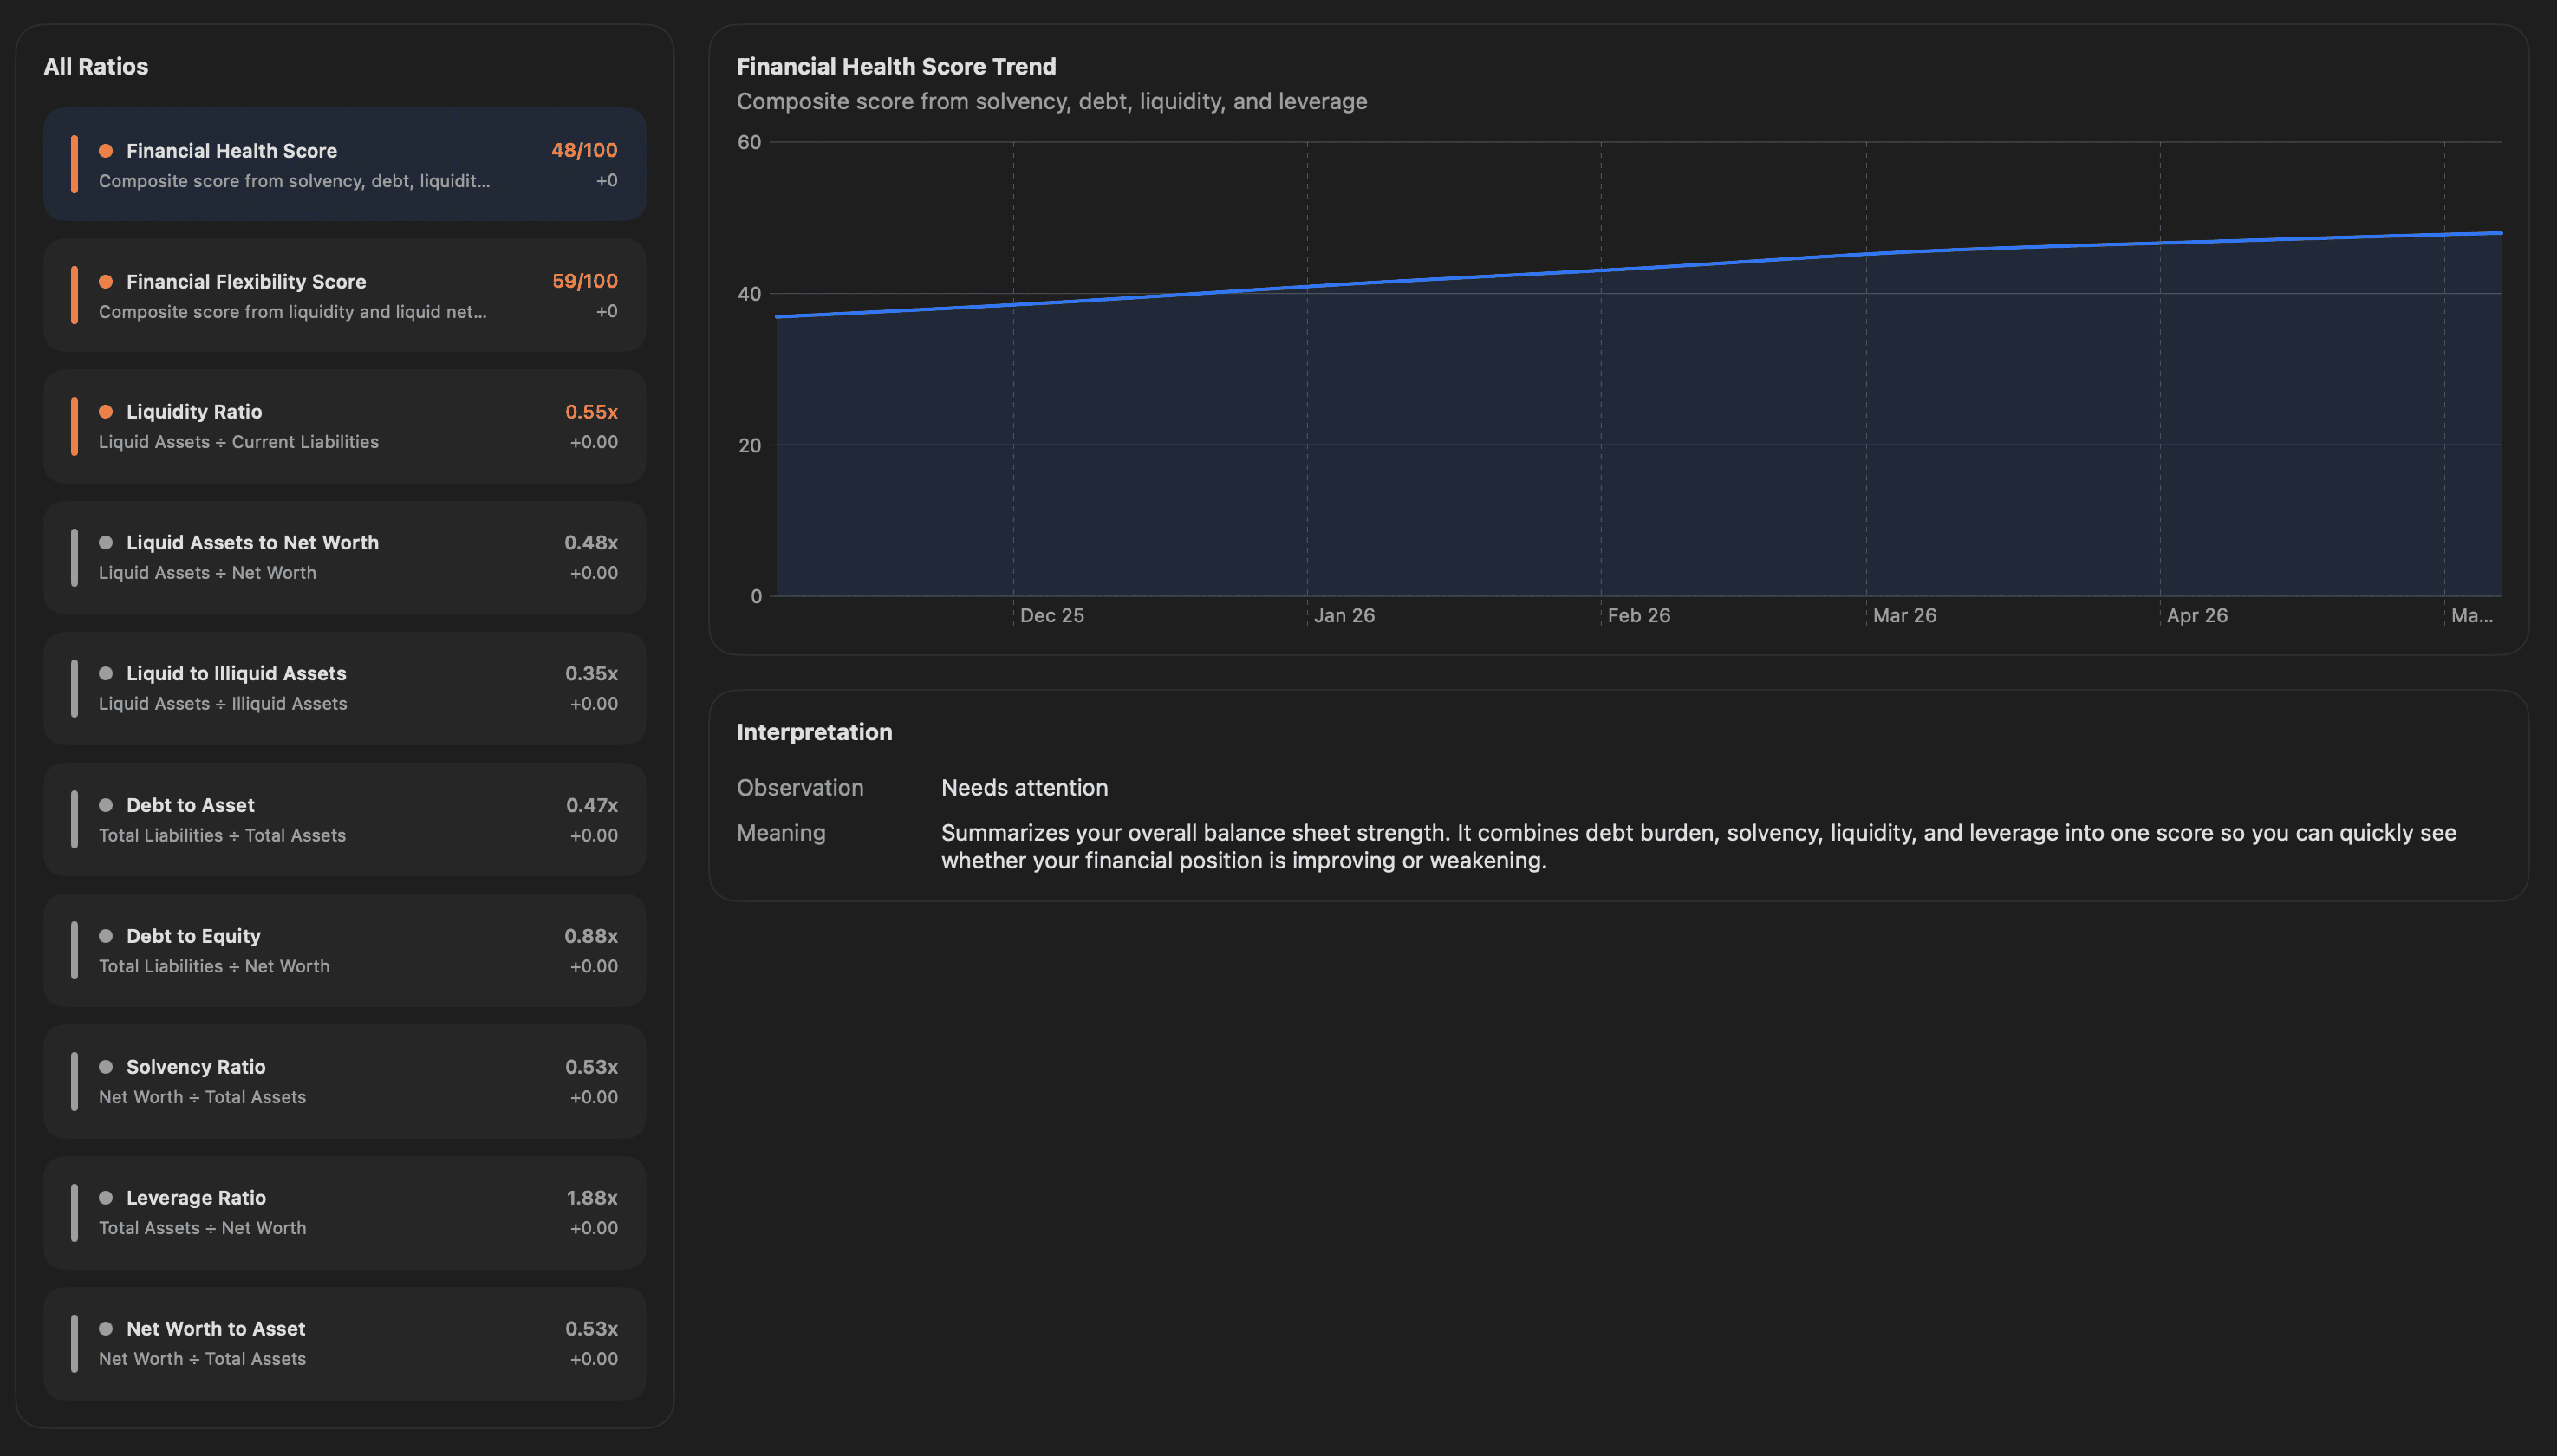
Interactive Ratio Cards: Click on distinct ratio panels, such as your Liquidity Ratio or Debt-to-Asset Ratio, to toggle your focus.
Ratio Trend Graph: Displays a dedicated longitudinal line graph showing whether your financial vulnerabilities are improving or worsening over time.
Contextual Interpretation: Displays automated text assessments explaining what your current ratio position means for your risk profile.
Example: If your ratios show all green metrics, this text block signals that you have the structural resilience to aggressively deploy capital or comfortably accept an investment loan.
The Settings Screen
The Settings Screen is where you control global app parameters, execute local data backup routines, and generate clean auditing output files.
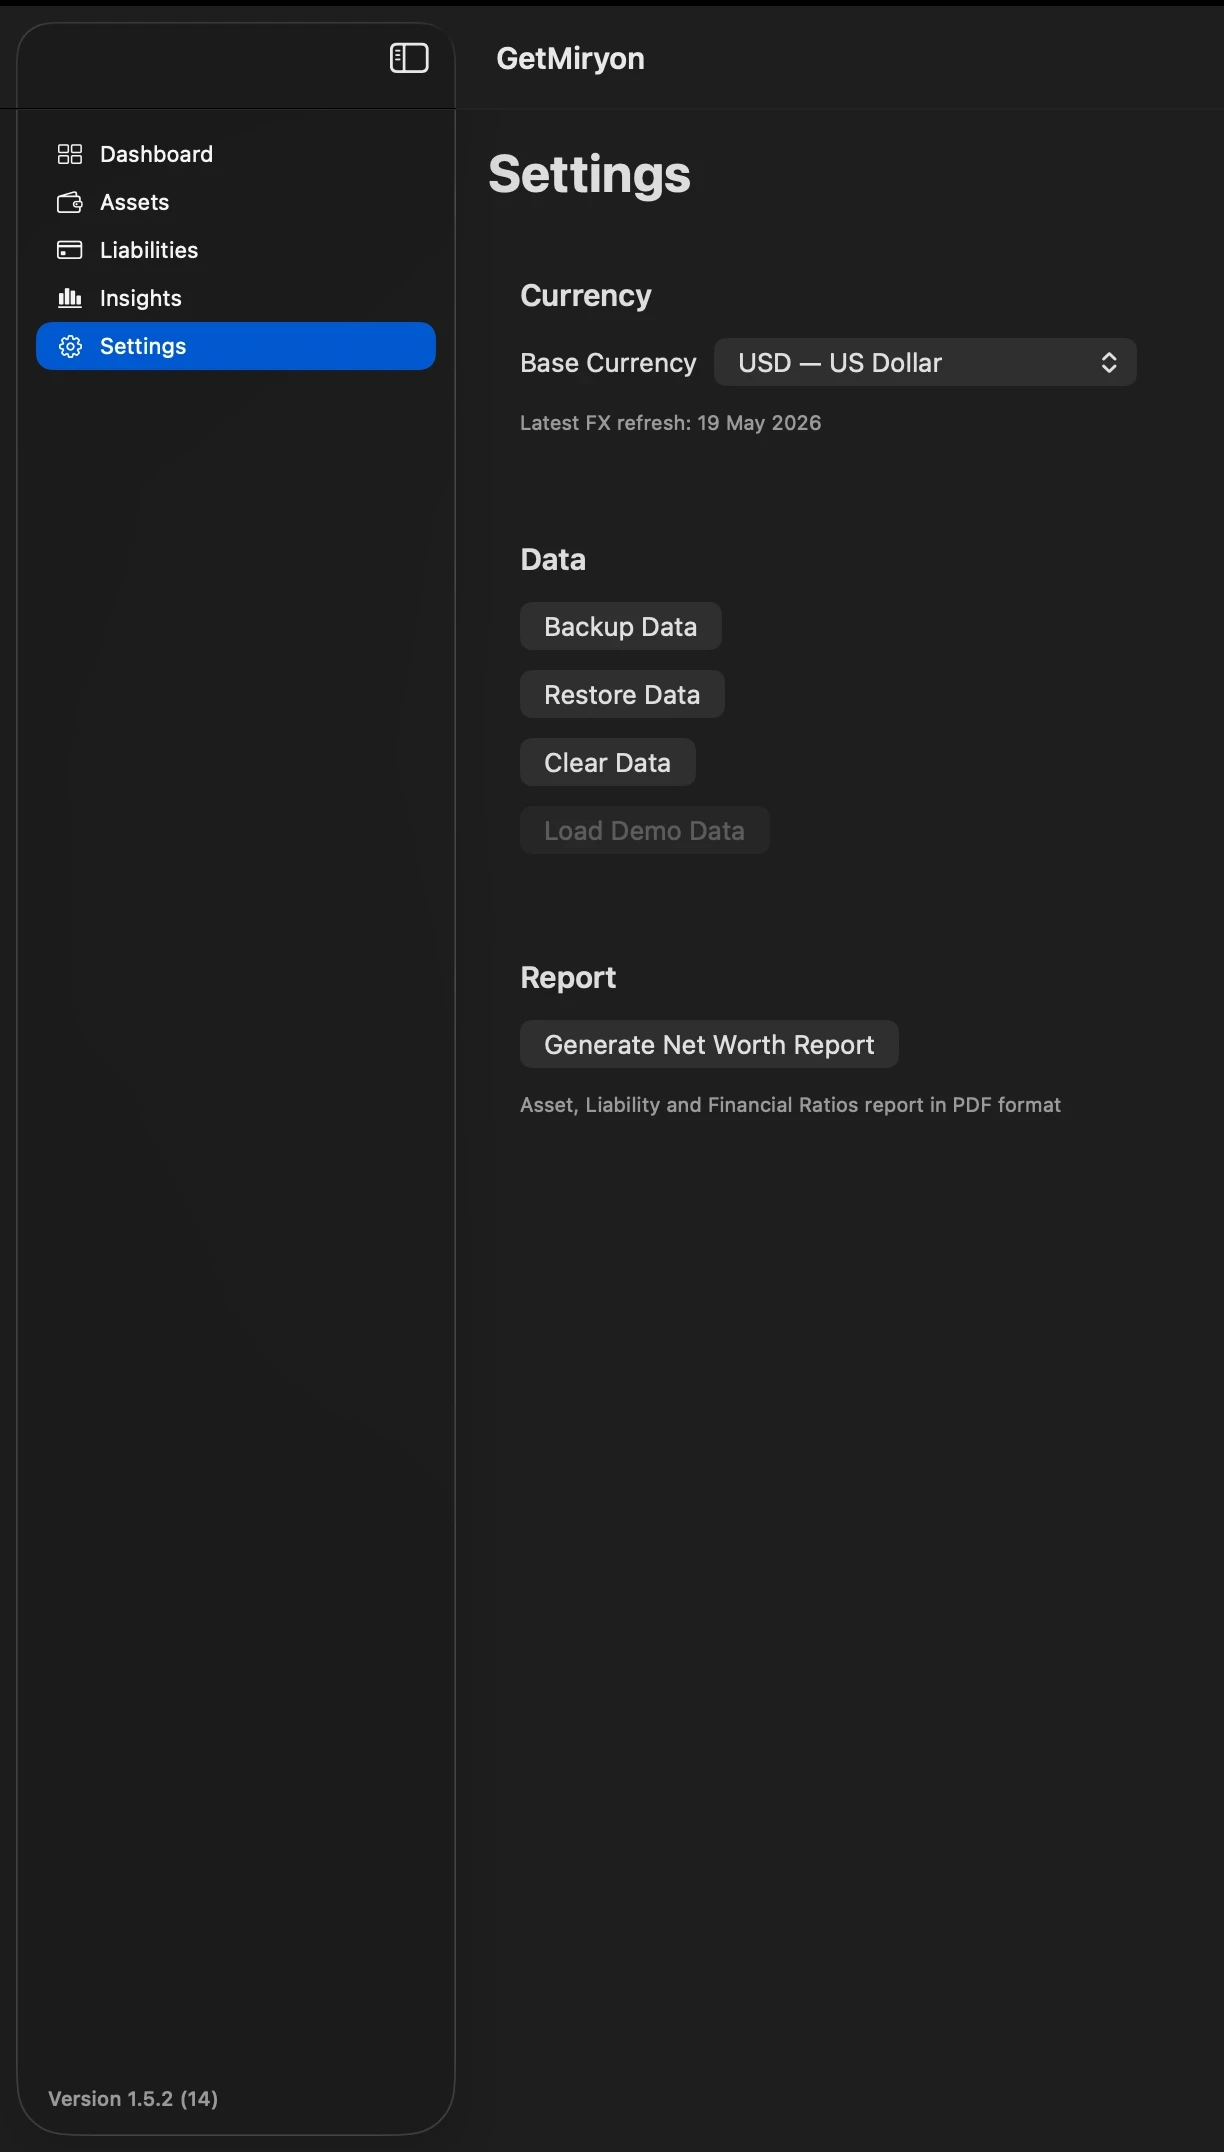
Global Base Currency Configuration
Select your primary Base Currency here. The second you update this field, GetMiryon’s local calculation engine instantly re-maps every multi-currency asset and liability using current, anonymously fetched FX rates to fit this uniform baseline denomination.
Data Backup & Restore
Because GetMiryon uses no corporate cloud, you are the sovereign master of your data. These tools protect that custody:
Backup Data: Instantly exports your complete balance sheet and financial history into an uncompressed, highly portable JSON file with a custom
.gmbkextension. You can store this backup file wherever you choose (such as an encrypted external drive or a private cloud folder).Restore Data: Select a previously exported
.gmbkfile to restore your settings. Note: Restoring data completely overwrites whatever database is currently loaded in the desktop app.Clear Data: Wipes your local workspace clean. Before your local data is wiped, GetMiryon automatically opens an interface offering to generate a backup file so you never accidentally destroy your history.
Load Demo Data: Populates your application workspace with a pre-configured sample financial portfolio. This is perfect for first-time user orientation, letting you test out timelines, ratios, and dashboards before entering your private records.
Financial Reporting Output
Generate Net Worth Report: Compiles your assets, liabilities, and current valuation states into a clean, professionally formatted PDF Report. This document serves as an offline asset audit overview for your private archives, your business accountants, or as an estate planning map for your family heirs.
Next Steps in Your Mastery Journey
Now that you are familiar with GetMiryon's user interface, explore our deep-dive configuration guides to optimize your setup:
Go Deep on Asset Configuration: How to Add, Edit, and Update Assets in GetMiryon
Go Deep on Liability Tracking: How to Add, Edit, and Update Liabilities in GetMiryon
Just Liquidate Your Asset or Paid Off Your Liability? This is the best practice with the data
